Catalyst Blog
Featured Post
For the Enterprise, Coding Co-pilots Are Simply Not Enough
The hype around one specific part of next generation software…
SEARCH & FILTER
More From The Blog
Search for
Category

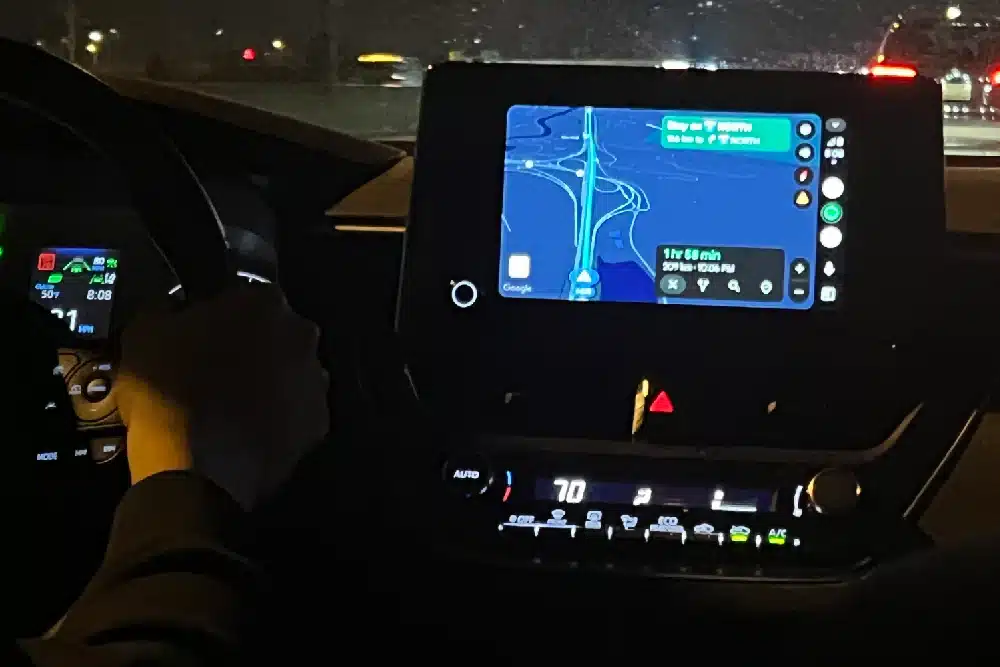
Automating QA for Automotive Applications
Whether you’re building a music app, an EV charging service,…

When AI Accelerates Everything, Security Has to Get Smarter
Software delivery has entered a new phase. Since 2022, AI-driven…


The Invisible Wall: Why Secured Apps Break Test Automation
Modern mobile apps are more protected than ever. And that’s…

Shared, Not Exposed: How Testing Clouds Are Being Redefined
The Evolution of Device Clouds: From Public to Private to…

Evolving Application Security Documentation, One Step at a Time
In 2024, the documentation team at Digital.ai launched a new…

AI in Software Testing: Hype, Reality, and Where Teams Actually See ROI
If you believe the marketing brochures, AI is about to…