Published: September 11, 2026
The Spreadsheet Is the Tell

Somewhere in your organization there is a spreadsheet. Someone built it because a director asked a question the testing platform could not answer directly: which projects are actually using the device lab, or how much testing a team ran last quarter. They exported what they could, pasted it into a sheet, wrote a few formulas, and sent it up. It worked. So now they do it every month.
Nobody escalates this. It never appears in a QBR, a support ticket, or a feature request. It appears as a recurring block on one person’s Friday afternoon, and it is the single most reliable indicator that your testing program has a visibility problem.
What everyone is actually trying to find out
Underneath that spreadsheet is a handful of ordinary questions. Testing leaders and platform administrators want to know how the program is performing and whether the resources behind it are being used well. Testers want a clear view of execution results for the projects and time periods they own.
Answering any of them means pulling signals from different corners of the platform — test results, projects, devices, usage — and none of those tells the story alone. Someone has to export them, line them up, and work out how they relate. That someone is why the spreadsheet exists.
And the shape of the problem isn’t unique to testing. In IBM’s 2025 CDO Study1, 77% of data and analytics leaders said data silos hinder their organization’s ability to perform real-time analytics and make data-driven decisions.
Solved problems stop getting reported
The workaround is the evidence. When a team has already built its own answer to a gap, the gap goes quiet. They are not going to raise it in a roadmap conversation, because from their point of view it is handled. The report goes out, the director gets the number, the cost is absorbed into someone’s job description. The problem has been converted from a product gap into a labor line, and labor lines are invisible until somebody goes looking for them.
This is why asking “do you have reporting?” produces a useless answer. Everyone has reporting. What differs is what it costs to produce, how current it is when it lands, and whether it can tell you anything about where your testing effort is actually going.
Assembly is the job now, not analysis
The cost of that work is measurable. In dbt Labs’ 2025 State of Analytics Engineering Report2, 57% of data practitioners said they spend most of their workday maintaining or organizing data sets rather than analyzing them, effectively unchanged from the year before, despite a surge in AI tooling. Poor data quality remained the most frequently cited challenge, named by more than 56% of respondents.
Those are analytics professionals, whose entire job is data. The pattern in a QA organization is the same shape and usually worse, because the person assembling the report is a QA lead or a platform administrator doing it on top of their actual role. You don’t have a data problem. You have an assembly problem. The sessions, projects, device usage, and test results are already there. Someone just has to spend their Friday afternoon turning them into an answer.
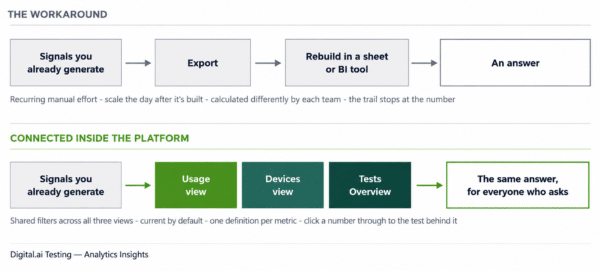
The same signals, two paths to an answer. Only one of them is repeatable.
Three decisions, not three dashboards
Connected visibility exists to support decisions that every testing organization makes, all of which have money attached, and most of which are currently made on instinct or on a number somebody rebuilt by hand.
- Are we spending on the right infrastructure? Which devices and OS versions are in real demand, which sit idle, and whether capacity matches actual usage. Most leaders can describe their device inventory precisely. Their device utilization, not at all.
- Is the platform actually being adopted? Which teams and projects are using it, where adoption is growing, and where it stalled after onboarding and nobody noticed.
- Is our testing effort going where it should? How much testing is happening, how that is trending, and which projects account for it.
Ask someone how they justified their last request for more devices. If the honest answer is “we knew we needed them,” that is a capital decision made without data, and it is being made annually.
The coverage problem is worse than the speed problem
A slow report costs you a day. The quieter failure is that nobody can tell you whether the testing is pointed at the right things.
Here’s the test.
Pick a team and ask which devices they ran against last sprint, and why those ones. You’ll usually get one of three answers: “that’s what’s in the config.“, “that’s what I was assigned.” or “that’s what we’ve always run.” All three mean the same thing, the list was inherited, not chosen. It was probably right when someone set it, but it may not have been revisited since, because revisiting it means pulling together data that takes real work to understand.
A shared data layer doesn’t make anyone smarter. It just means someone can finally ask which devices actually matter, how much of the suite is aimed at them, and what’s being spent covering the ones that don’t.
Ask a better question
The next time you are assessing whether your testing program is measurable, do not ask whether you have reporting. Ask this instead:
“How long does it take to get an answer we trust, and who has to be involved to produce it?”
That question surfaces the spreadsheet, the export, the person who maintains the pipeline, and the two-day lag between the question and the answer. It reframes the conversation away from features and toward operating cost, which is where the real number lives.
And when you find the spreadsheet, find the person who maintains it. They have been quietly subsidizing this gap for a year, they know exactly what it costs, and they will be the most credible voice in the room when you decide to fix it.
Where this connects to what we built. Advanced Analytics in Digital.ai Testing is our answer to the assembly problem specifically: usage, device, and test execution views inside the platform teams already work in, removing the step where somebody rebuilds the same view every month.
Explore Digital.ai Testing Premium.
Sources & References
1IBM Institute for Business Value, The 2025 CDO Study: The AI Multiplier Effect — 77% of respondents agree or strongly agree that data silos hinder their organization’s ability to perform real-time analytics and make data-driven decisions. The 2025 CDO Study: The AI Multiplier Effect
2dbt Labs, 2025 State of Analytics Engineering Report — 57% of data practitioners spend most of their time maintaining or organizing data sets; poor data quality cited by 56%+ as the leading challenge. 2025 State of Analytics Engineering Report
You Might Also Like

Apple’s First Foldable Is Here. Is Your App Ready for It?
Apple’s first foldable iPhone, iPhone Duo, introduces something fundamentally different…

More Tests Are Easy. Managing Them Is Getting Harder.
Test automation keeps growing. Teams are building more Appium tests,…
